
What is an Infographic Really?
Simply put an Infographic is a visual representation of information using elements such as charts, images, and text.
“a good infographic is worth a thousand words”
So, in principle, an infographic can have three building blocks – Texts, Images and Charts laid out in a visually impressive manner to convey some idea that anyone can easily grasp.
Most often than not, infographics take the form of a List. Because it is no secret that people just love bullet point lists. Five ways to do this, ten ways to do that, fifteen things you should do, twenty things you should not etc.. Lists are soothing and simple. They provide instant gratification and purpose.
So, infographics are usually Lists with Text, Images, and Charts.
How to Make Infographics with iList?
iList lets you make Lists with Images, Texts, and Charts. The main concept is just that simple. You can do more with iList but we will get to that later. Let us dive right into how to make your Lists or iLists as we call it – which essentially happen to be infographics.
Before getting started – to make any infographics, first, you need a List of items or the bullet points. Just the base structure will do to start with. You can adjust, add, edit them anytime. That’s another beauty of iList. You do not need to fire up photoshop or go to another website to change your infographic. Everything is manageable right from your WordPress backend.
As is the norm, bullet points of your iList should be short and sweet. Typically 1 to 2 sentences works the best. For our text case, I am borrowing some of the points from one of Neil Patel’s articles: 45 Content Marketing Best Practices That Are Actually Myths and turning it into an infographic.
Check out this short video overview on how to get started with the WordPress Infographic Maker iList Pro:
Step 1: Start Your iList with (catchy) Title
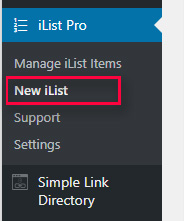
OK, so let’s go to our Infographic Maker iList and Press on that New iList button. The next page is where most of the actions will take place. So, we will go through each option and steps in far details in the next few paragraphs.
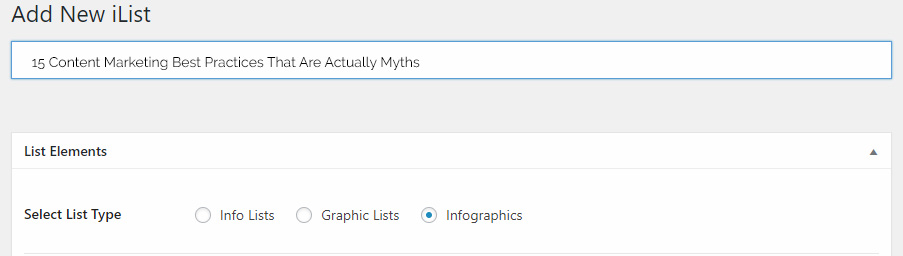
We will begin by giving our infographic a Title. Preferably a catchy one to grab user’s interest. In this case, I have titled it as “15 Content Marketing Best Practices That Are Actually Myths”. In the next row, we have three options – Info Lists, Graphic Lists, and Infographics. Infographics is selected by default – so nothing needs to be done there.
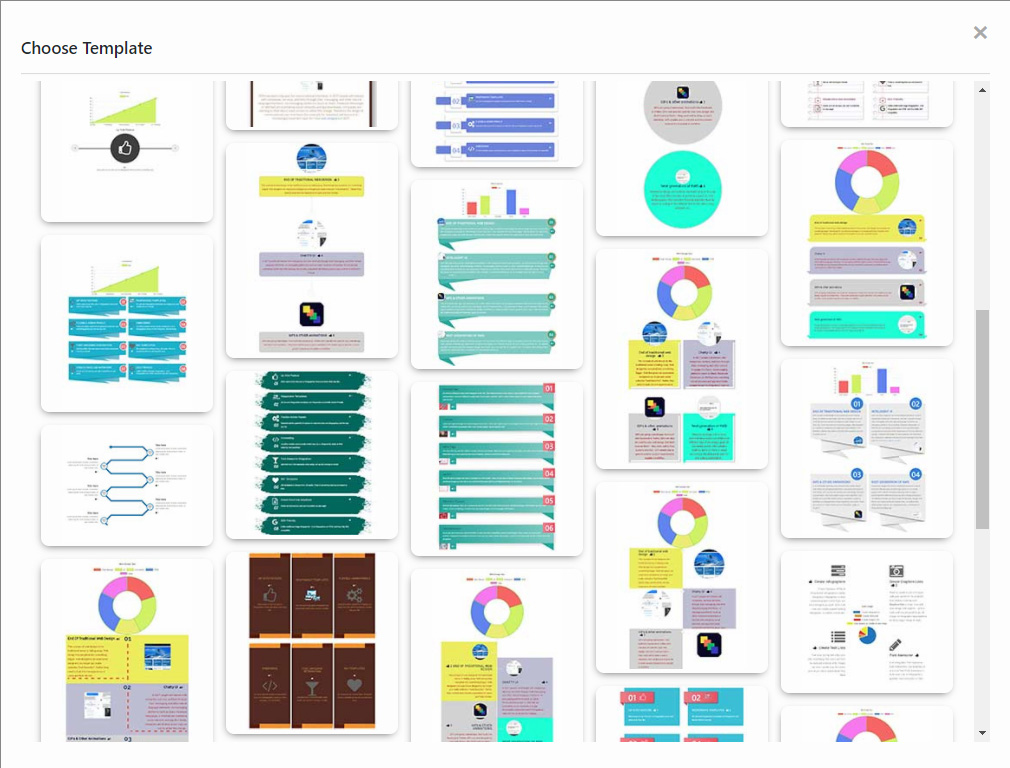
Step 2: Pick Your Choice of Infographic Template
Next, you can select a template for your InfoGraphic from a lightbox window which shows a preview of all the available templates. There are about 65 templates to choose from at the time of this writing. We add new templates every month. Click on the template you want to start with. Don’t worry. You can change it later. Anytime!
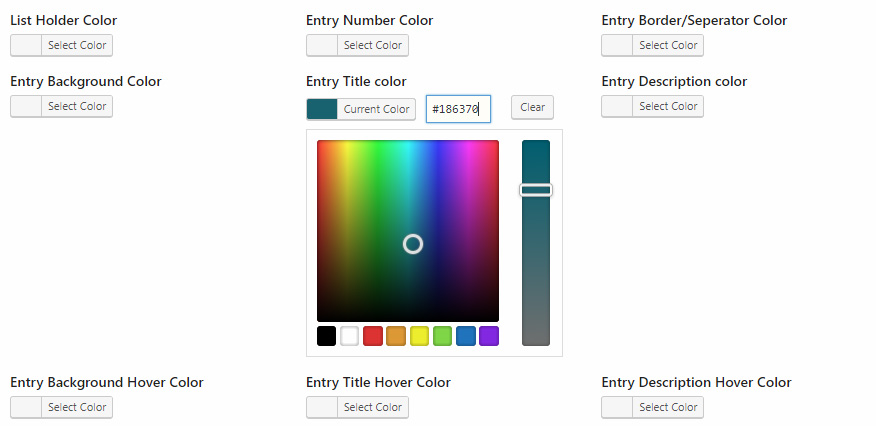
Step 3: Pick Colors for Your Infographic
Next, we have a bunch of options to color customize your infographic. Like changing the title or description font colors or the entire infographic’s background color. They can make your infographic look more interesting but not mandatory to use. You can change them anytime later also.
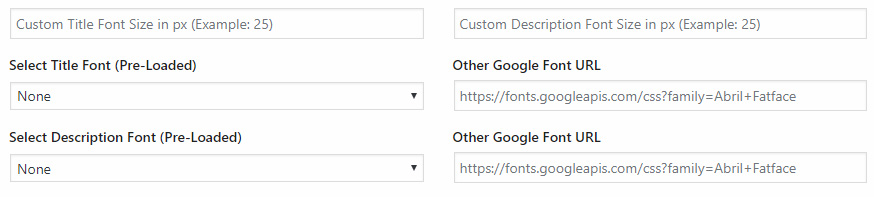
Step 4: Customize Fonts to Make Your Infographic Interesting
You also have the options to pick your choice of any of the 800+ google fonts just for your infographics. You can assign different google fonts for your titles and descriptions. iList can take any google font style link from https://fonts.google.com/ . Again, these are for fine-tuning and customizing your infographic. You do not have to use them right now. You can play with them later or not use them at all.
Step 5: Use Chart (Optional)
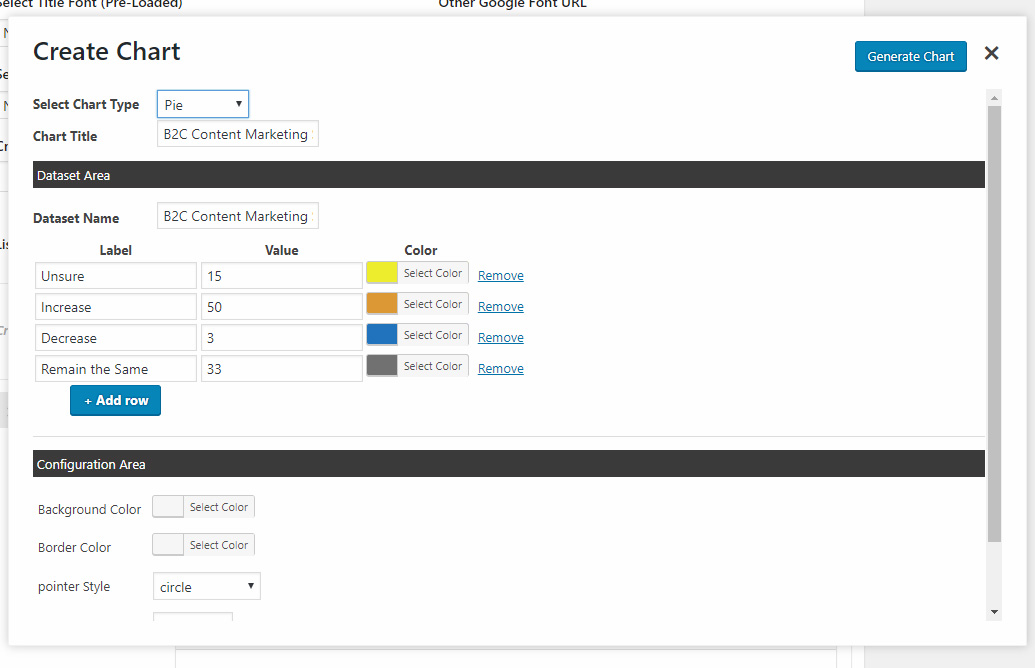
Not all infographics need a chart. In fact, most do not. But yours might. In the next area, you can generate and include a chart or graph directly from the iList interface! Isn’t that great?

Creating chart is super easy. Click on the Create iList Chart text area and in the popup chart generator just add a chart title, a label for each data set and the number. You can also choose where to show the chart – at the top of your infographic or middle or bottom. All without leaving your infographic creation space.
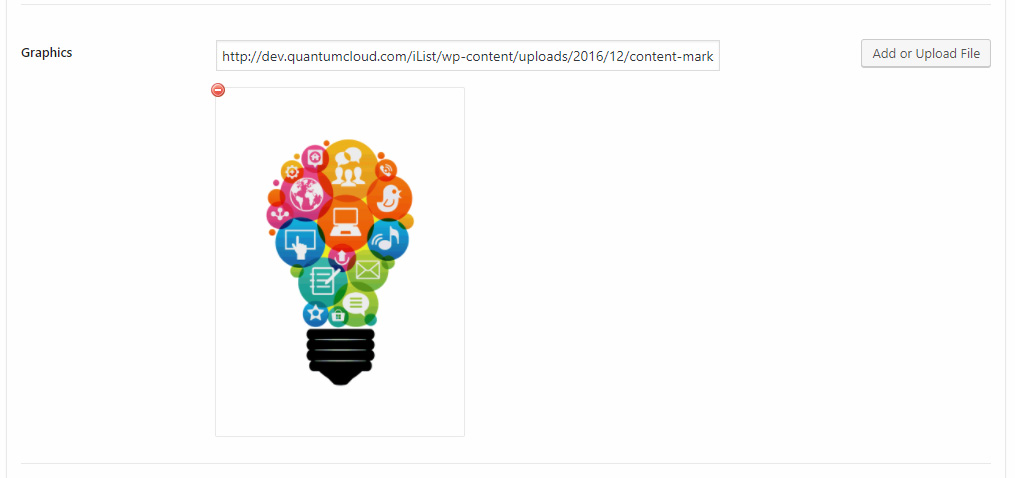
Step 6: Middle Image
Alternatively, you may not want to use a chart but show an image instead. That is also possible and some templates do require a larger sized image. Not all of them do. You can upload that image in the next section. It is worth mentioning that you can either show a chart or an image but not both in the top, middle, bottom position. But some templates do support both. So, choose your template wisely. Since we are showing a chart for this example infographic – we will not be uploading any middle image.
Step 7: Add Your Infographic Bullet Points
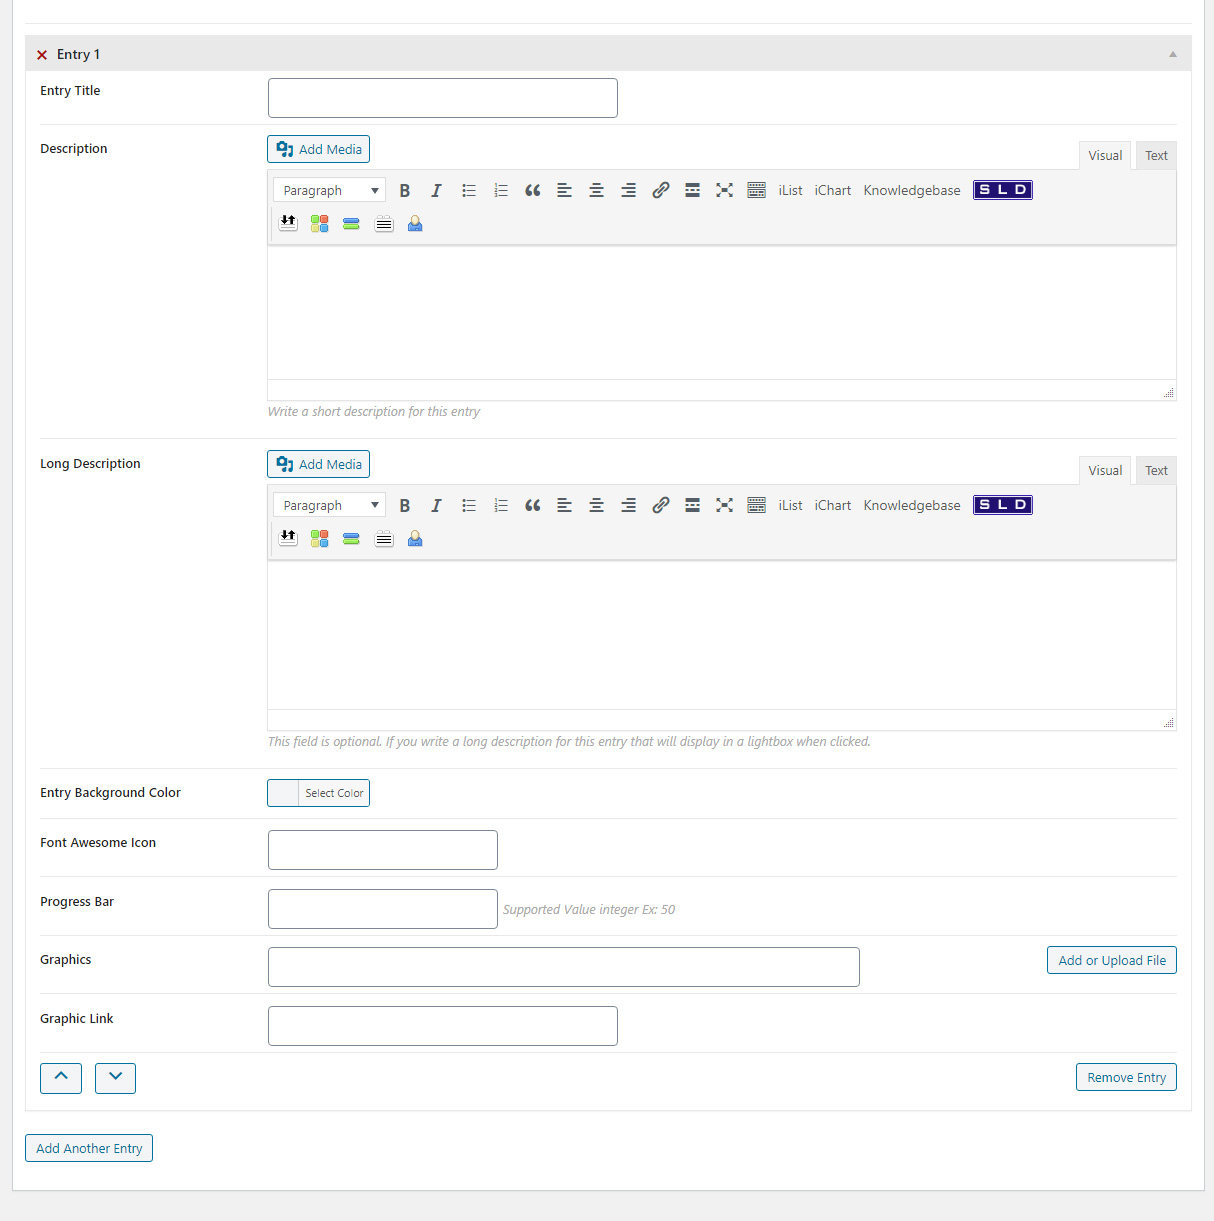
Now comes the fun part. We can now start adding our bullet points. Each bullet point or list items can have a Title Text, Description Text, and Image (or Icon). From the original article, we are adding the following for our 1st bullet point:
Title: Content marketing isn’t for my niche
Description: There is no niche that content marketing wouldn’t benefit. Don’t fall for this myth because it will be detrimental to your business.
Image: To illustrate my point, I needed an image. So, I hunted down a relevant image from the internet and uploaded.
There are a couple of more notable things here.
- Notice that you can select a background color for each List item. This will affect only this bullet point or list item alone. You can assign different background colors for each of your items. Not only this option makes your iList infographic more interesting – you can also denote the importance of particular list item with this feature.
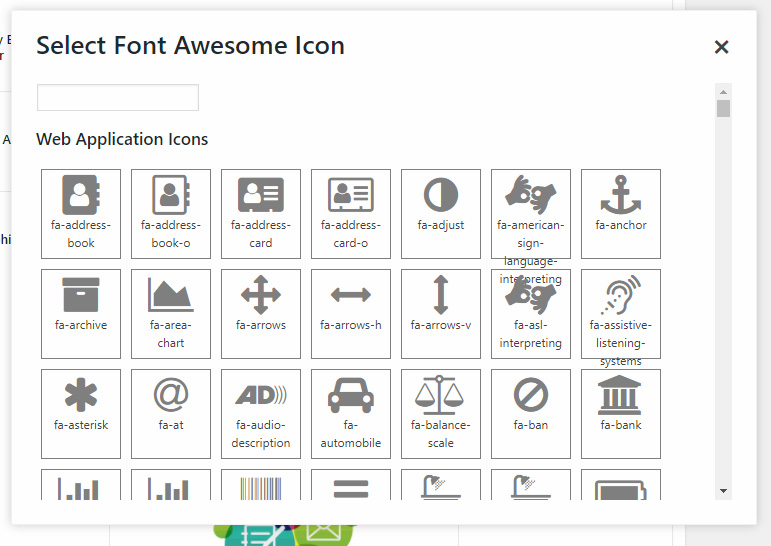
- If we are too lazy or just do not have any relevant image – we could just use a relevant icon instead. We have seamlessly integrated 700 font awesome icons. They are categorized and even searchable! Now isn’t that awesome? Note that, if you uploaded both an image and selected a font awesome icon – the image will take priority and show in your infographic.
- The Long Description field is optional. If you add any Long description, it will show in a lightbox modal when clicked. you can add Video, Images and longer text in the long description with formatting using a visual text editor.
Click on the Add Another Entry to add your next bullet list item and keep adding until your list is complete. Go ahead and publish the infographic. Don’t worry, it won’t start showing on your website until you add the shortcode on a page.
We got tired after adding 10 entries. But no problem. With iList I can publish what I have now and come back later and add more – anytime. That is another convenience of iList. With a graphical infographic, it can take 20-30 minutes to add a new entry depending on the design complexity. With iList you can do so in a minute without firing up your photoshop or the help of your graphic designer.
Step 8: Publishing Your Infographic
The final step is to publish your infographic on a page or post. You can publish the infographic inside any of your existing page or post contents or create a new page for this. This is done with a shortcode and the easiest way is to use the Shortcode Generator we added for your conveniences in the visual editor bar.
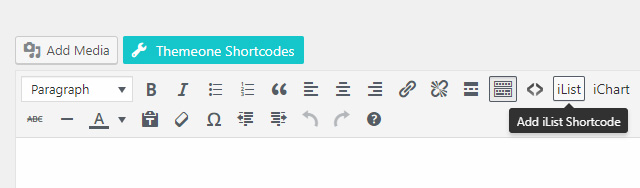
Place your cursor where you want the iList infographic to show up. Clicking on that small shortcode generator button will open a lightbox pop up window with all the shortcode options. There is no need to refer to the documentation to hunt down the shortcode parameters.
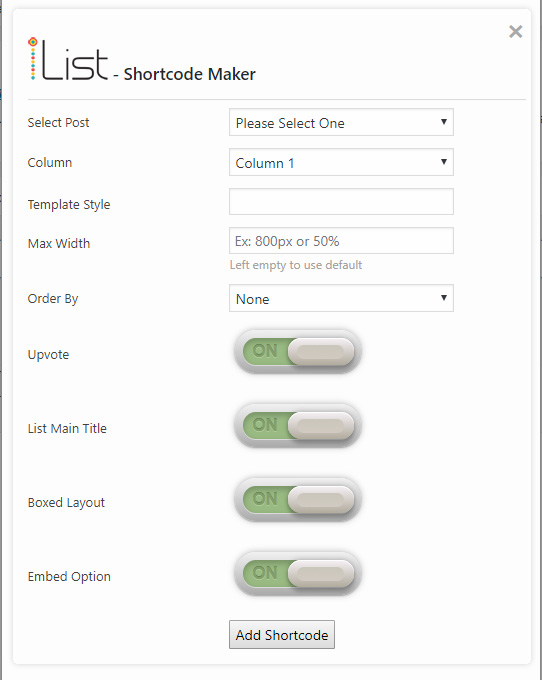
Let’s go through the options briefly:
Select Post: Pick the infographic by title that you want to show on your page
Column: Most infographics look the best with one column. But some work better with two columns
Template Style: You have already selected a template style from infographic creation page. But from here, you can override that and pick a new template. Leave em
Max Width: By default iList infographics will take the full width of the container it is placed on. But you can limit that to a preferred pixel or percentage width value. Example: 800px or 50%
Order By: One of the kool features of iList is that people can UpVote your individual infographic entries. You can order by that UpVote count or leave to the default ordering of your iList – which you can reorder with drag and drop.
Upvote: You can turn the UpVote option on or off
List Main Title: Hide, if you want
Boxed Layout: Will render your infographic inside a great boxed design with subtle shadow effect
Embed Option: Allow people to Share your iList infographics on their own website! You can potentially earn backlinks when they do so.
Press the Add Shortcode button once you have chosen the options. Publish your page and voila – you are done!
Here is what we have created in this infographic maker tutorial – 15 Content Marketing Best Practices That Are Actually Myths. Pretty great result for less than 15 minutes of work 🙂
But, “I want an Image of my Infographic to share on pinterest” – you say. No problem. You can just take a screenshot of the page using the print screen button on your keyboard where you published the infographic and crop with an image editing tool. Takes just another minute.
Bonus Tip: You can go back to manage your infographic and quickly change to another template, save, reload the page and see if the other template looks and works better.
Bonus Tip No. 2: iList comes with iChart shortcode generator. Use the iChart button in your page’s visual editor to generate and display a stand-alone chart or bar easily and independently of
Bonus Tip No. 3: You can use iList to create simple Text List or Graphics List as well. We have specialized templates for these use cases as well
If you have not already, Buy iList
Leave a comment if you had a question or feedback to make iList better.

Leave a Reply